Who Feels Safe on Transit?
The perception that public transit is unsafe can lower travelers’ willingness to ride. It can also deter riders from traveling on transit at night, reducing their freedom of movement. To feel safe, riders may travel longer and less direct routes to avoid places they do not feel comfortable traveling through. Riders can feel unsafe from a broad range of perceived threats, including automobile traffic, crime, harassment, violence, and police profiling. A recent review of qualitative and gray literature led by MJ co-lead Orly Linovski (University of Manitoba) highlights these safety issues as significant barriers to transit use among equity deserving residents across Canada. These issues are not limited to Canada, a recent multi-city survey illustrates that gender disparities in the perceived safety of public transit exist among transit riders living on six continents.
Mobilizing Justice was recently given the opportunity to analyze survey data on transit riders’ perceived safety. Transit app, an MJ partner, provides real time transit information (bus arrival times, crowding levels) to transit riders across North America. As such, its Rider Happiness Benchmarking (RHB) survey is completed by more than 26,000 transit riders, including more than 9,000 in Canada. Transit app generously provided this survey data to Mobilizing Justice in the interests of advancing equity. This post presents a high level analysis of app user responses regarding how safe they felt riding transit.
Respondents were asked to rate whether they “felt safe while waiting and riding” on a five point scale. A 5 indicated “strongly agree” and a 1 indicated “strongly disagree.” For this analysis, the responses “strongly agree” and “agree” were combined into one category, “Agree,” while “strongly disagree,” “disagree”, and “unsure” were combined into a “Disagree” category. This simplification gave us a variable that indicated whether someone generally felt safe waiting and riding or not, allowing for an easier comparison of safety perceptions between different groups of riders. If a policy goal is for every rider to feel safe on transit, this aggregation of the survey question allows us to benchmark how close we are to this goal.
This post examines differences in perceived safety as reported in the October 2021 RHB survey along lines of gender, race, indigeneity, income, disability, and the rider’s primary transit agency.
Gender
Overall, Canadian respondents felt safer than those in the US, but males report significantly higher levels of perceived safety on transit in both countries as confirmed by t-tests. Figure 1 below presents these differences. The gender gap in perceived safety is about the same in both countries, with males around 8-10% more likely to feel safe than females*. Non-binary and non-conforming respondents report the lowest levels of perceived safety, at just over 54% in both countries. These findings are consistent with prior research that also suggests this disparity contributes to women’s social exclusion.
Race
Perceptions of safety can also vary by race due to problems of racial profiling and harrassment. Over a fifth of racialized Canadians report having experienced harassment on public transit at some point in their lives, for example. Surveys from Sao Paulo and Los Angeles similarly confirm that white riders tend to feel safer in those cities compared to those from other backgrounds. Among U.S. respondents in Transit app data, White riders feel the safest (68%), followed by Asian riders (60%), Hispanic* riders (58%), and Black riders (56%), and these differences are significant according to a chi-squared test. However, differences by race are not apparent among Canadian respondents, as presented in Figure 2. These findings contrast with the existing academic and gray literature, and this may be because our national level summary masks differences by province, as well as failing to control for other related factors. We intend to address these issues in future work.
Indigeneity
We also examined perceived safety along the lines of Indigeneity, as plotted in Figure 3 below. In Canada, a smaller share of Indigenous riders feel safe riding transit (58%) compared to non-Indigenous riders (70%), and this difference is statistically significant. Qualitative research sheds light on why this disparity exists. Documented causes include overticketing of Indigenous travelers by fare enforcers, lack of service in some communities requiring many Indigenous riders to walk long and unsafe distances, and prejudice and harassment on transit.
Disability
In both countries, people with disabilities feel significantly less safe riding transit compared to people without disabilities. Differences were also evident by the kind of disability a rider has, as presented in Figure 4. People with any kind of disability that limited walking felt the least safe, followed by those with any kind of visual impairment. Ultimately, these results may mask differences between people with different kinds of disabilities that fall within these categories, for example differences between those who are fully blind versus those who have low vision. Research suggests that safety for people with disabilities is critically important, as people with disabilities, women in particular, suffer the most from sexual assault.
Income
We also examined perceived safety along the lines of income, as plotted in Figure 5 below. In Canada, people making over $150,000 a year feel the safest (80%), while those under $40,000 a year are the least likely to feel safe (66%). A similar pattern is visible among U.S. respondents, and the differences presented below are significant according to chi-squared tests. These findings corroborate prior research from a national survey administered in the United States. That study revealed that residents on low incomes are more likely to perceive a lack of safety in their neighbourhood as a major barrier to transit use compared to residents with higher incomes. Study author Jeongwoo Lee goes so far as to conclude that “enhancing neighborhood safety is the necessary first step to increasing the utility of transit for low-income people.” Our results may also reflect income differences by transit mode: residents with higher incomes are more likely to use heavy rail and subway lines, which are more likely to serve stops that have staff and security.
Agency
Perceived safety varies significantly across the country’s largest systems. Respondents who use Transit app to ride STM generally feel the safest (78%), followed by TransLink riders (70%) and TTC riders (62%). Perceived safety is lowest among users of transit in Calgary (58%) and Edmonton (56%). Differences across these five agencies are statistically significant according to a chi-squared test.
Despite large variation between cities overall, disparities exist in each of the five systems profiled above along lines of race, gender, and income. This means that the disparities by demographics presented above are not caused by inequities in any specific region, but generally reflect a pattern that persists across the country’s major metropolitan areas. We did identify two exceptions to this pattern. First, the relationship between perceived safety and income is not present in Calgary, where perceived safety levels are similarly low across all income groups. This may be a function of a small sample size from that city relative to the others, however.
Second, differences in perceived safety between Indigenous and non-Indigenous riders are much greater in Calgary and Edmonton than they are in the other major cities, and overall.
Our city-specific findings corroborate recent media reports of transit riders’ complaints about the lack of safety on Calgary and Edmontons’ light rail systems. In response, Edmonton recently approved a $3.9 million Transit Safety Plan that includes a pilot partnership between the City of Edmonton, the Edmonton Police Service and the Bent Arrow Traditional Healing Society. The plan will hire additional peace officers and community outreach workers who will work together as part of a Community Outreach Transit Team (COTT). Calgary, meanwhile, plans to hire an additional 31 police officers with specialized training in transit enforcement.
What will it take to address transit safety?
Transit app survey data reflects what advocates and researchers have long known: males feel safer using transit than females, and these differences persist by country and region. Non-binary riders are the least likely to feel safe. People with higher incomes are more likely to feel safe than those on lower incomes. However, the data do not show significant differences in perceived safety by race in Canada. In contrast, Indigenous riders are less likely to feel safe than non-indigenous riders.
Highlighting socio-demographic differences in perceived safety helps us understand why addressing safety is crucial for building equitable, inclusive transit systems. But this disparity analysis does not point to clear solutions. For several decades, researchers and activists across the world have been investigating what can be done to address different aspects of transit safety. For example, researchers Vania Ceccato (KTH University) and Anastasia Loukaitou-Sideris (UCLA), offer a high level review of actions agencies can take on sexual harrassment. These include:
- Providing good lighting at stops and stations
- Placing bus stops in places that facilitate natural monitoring
- Conducting awareness campaigns against sexual harrassment on transit
- Including women in the planning and design (or redesign) of transit systems, stops, and stations, which means hiring more women into transit and planning professions
- Deploying ICT technology and using social media to communicate faster to riders, and to allow riders to report problems more quickly
- Training drivers and transit staff to be sensitive and responsive when responding to incidents
- Reducing overcrowding, as overcrowded environments enable harassment
While these recommendations were developed with sexual harrassment in mind, many of them are relevant to addressing other safety challenges, like crime and other forms of violence. Addressing safety effectively will also mean deploying strategies that do not stigmatize or target riders. A recent review of public transit barriers through the lens of lived experiences notes that efforts to police transit can make some riders feel less safe, particularly if they feel they are being profiled by transit officers because of their race or Indigeneity. These fears are reflected in ticketing data in at least one city, Toronto, where researchers found Black and Indigenous transit riders dramatically over-represented in ticketing enforcement data. To achieve equity, agency and government efforts to promote safety on transit must ameliorate, rather than further, existing racial disparities.
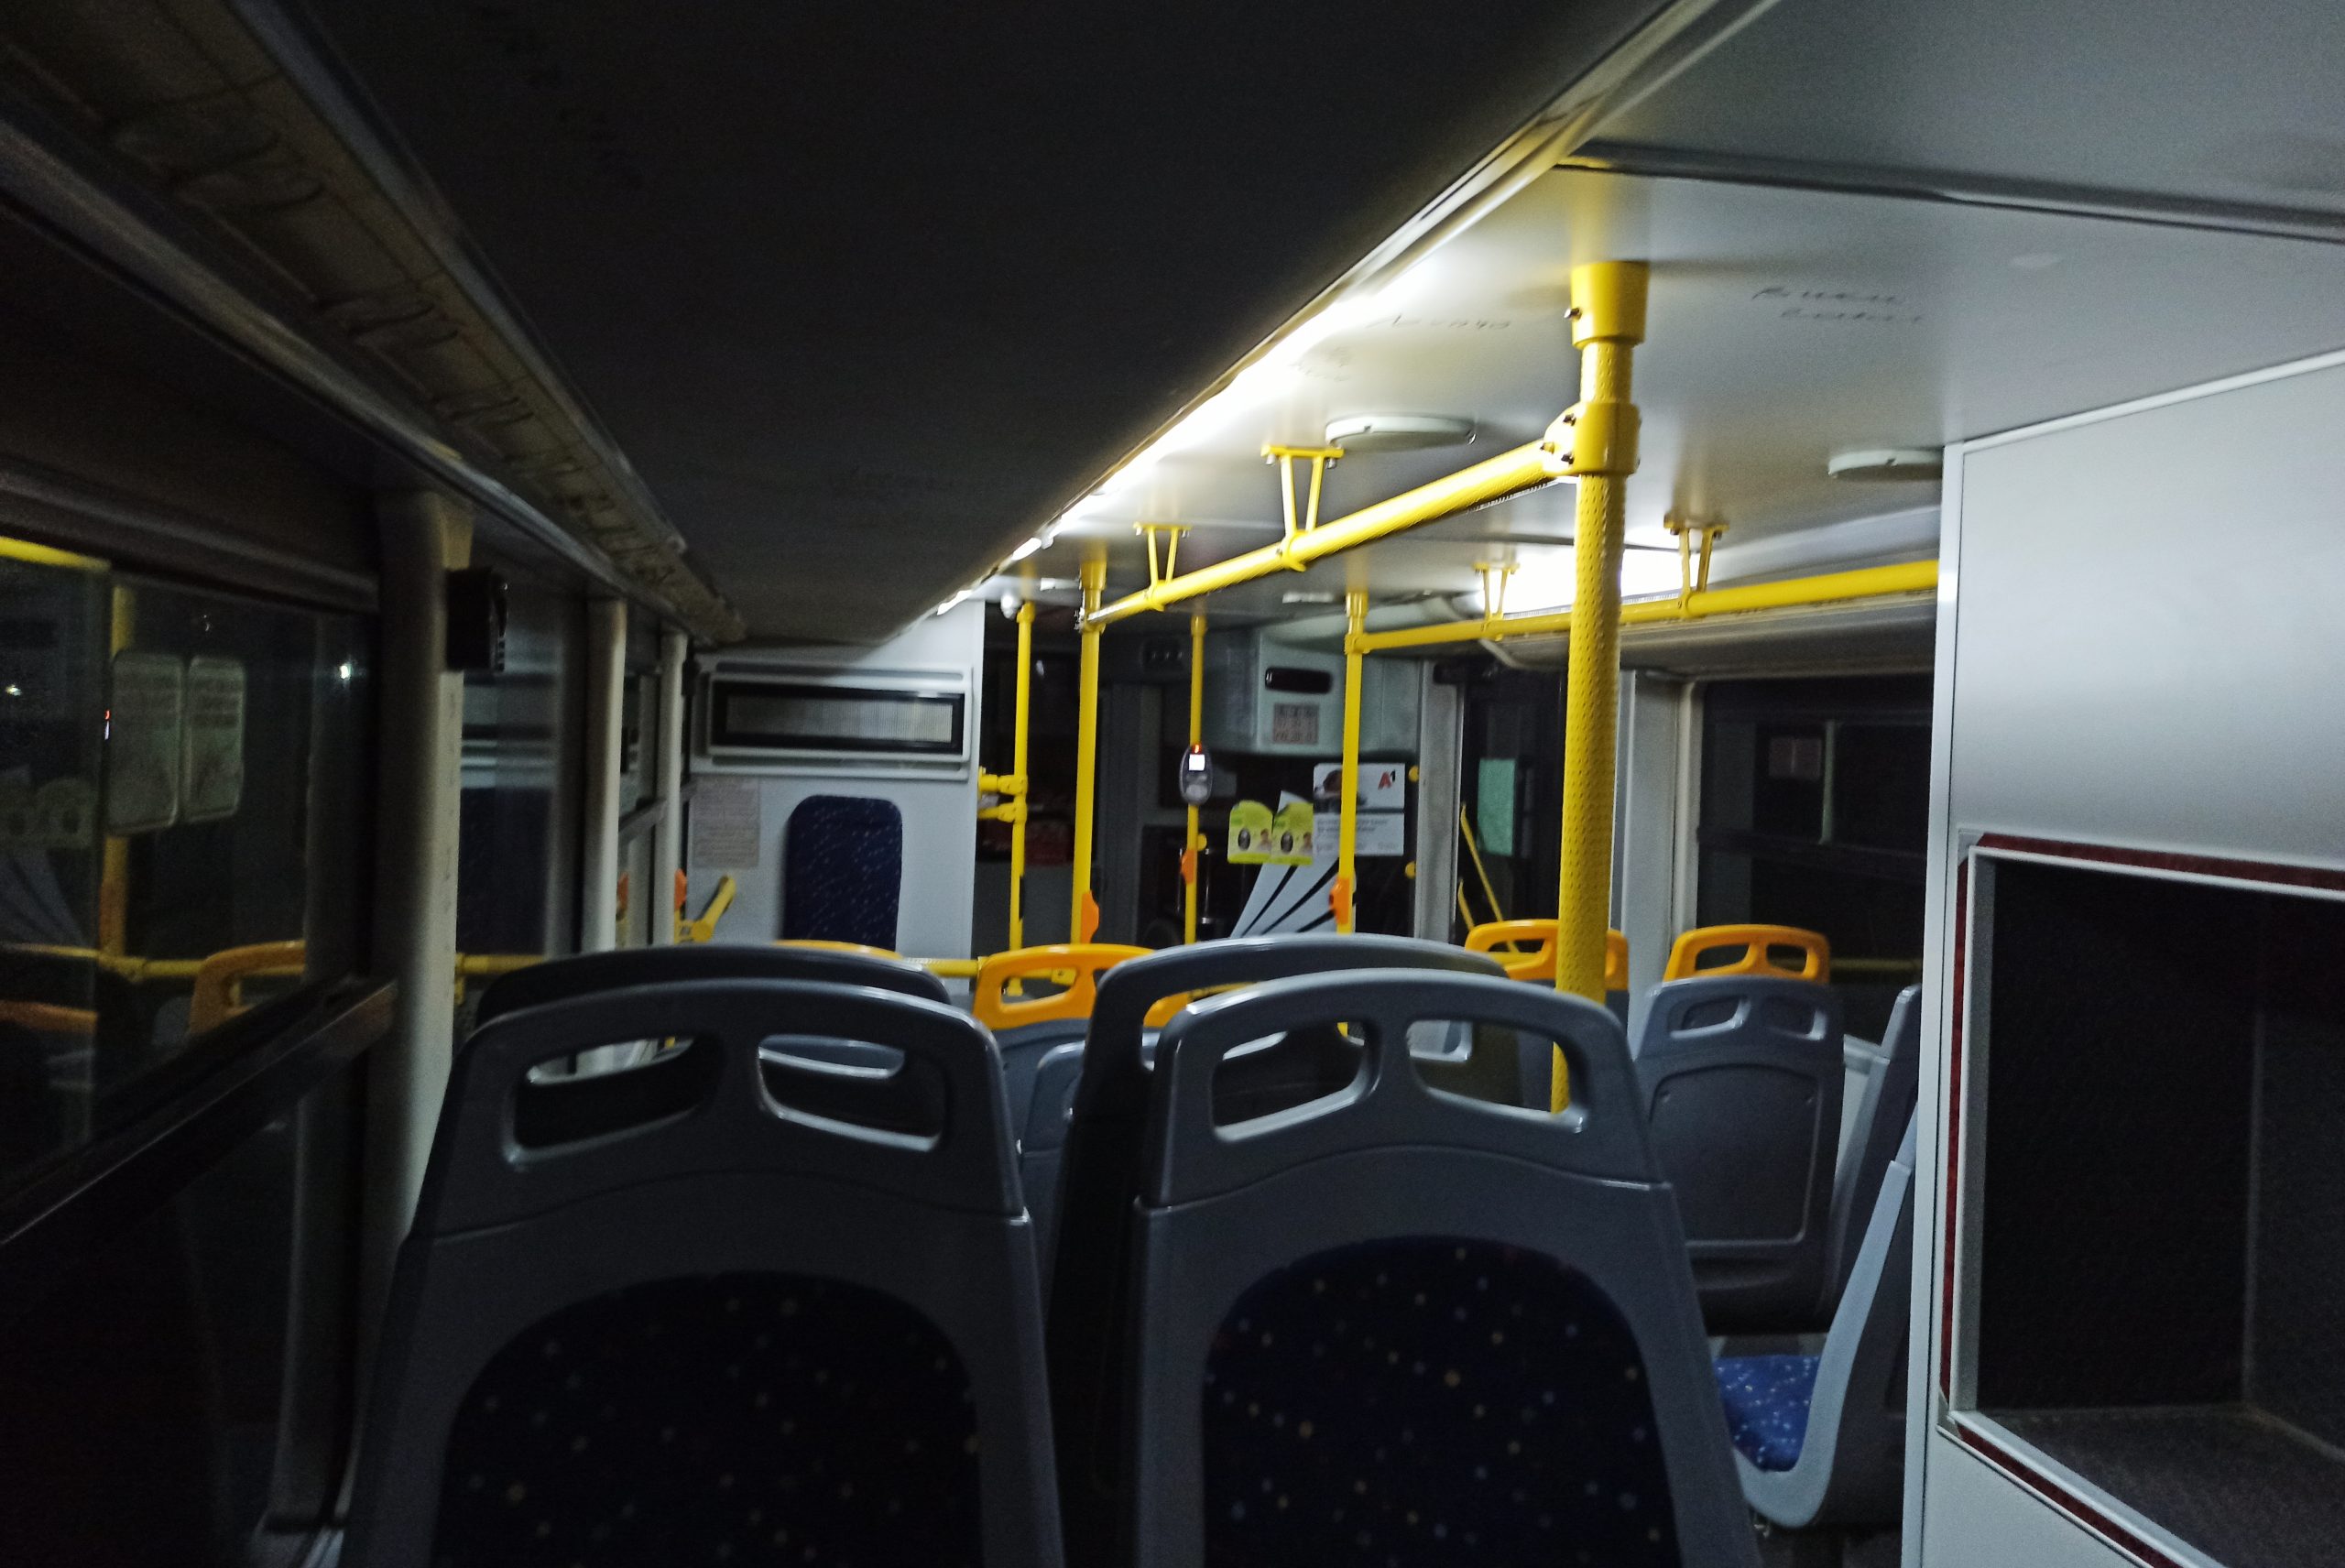
Cover photo by Martin Koloski on Unsplash.
*The authors use this terminology to reflect its use in the original survey.
Disclaimer: The research described in this piece was not funded by or conducted as part of Mobilizing Justice’s core work plan. The views and opinions expressed here are those of the authors and do not necessarily reflect the views or positions of Mobilizing Justice.
You may also like
 Removing Fare Barriers: Free Public Transit for Youth Experiencing Homelessness in Toronto
Noah Kelly is the Director of Research & Partnerships at the Transit Access Project (TAP) and has recently completed his Master of Arts at McGill… Read More
 The Hidden Price of Clean Transportation
Lessons from the Transition to Electric School Buses The French version of this blog post is available HERE. Canada’s 51,000 school buses… Read More
 Youth Experiences with Active Transportation in Yellowknife, Northwest Territories, Canada
About the Prioritizing Populations Study Group My name is Alexandra Sbrocchi, and I am a rural planner and third-year PhD candidate in the School of… Read More
