Are We Moving Towards More Equitable Bike Sharing? Applying a Socio-Spatial Lens to Public Bike Share Access in the City of Vancouver
In this blog post, Christine Yanagawa, PhD student from Simon Fraser University, shares findings from a socio-spatial analysis on access to public bike share in the City of Vancouver, as well as her insights on the importance of prioritizing equity in bike share systems.
This blog was penned on the unceded ancestral territories of the xʷməθkʷəy̓əm (Musqueam), Sḵwx̱wú7mesh (Squamish), and səlilwətaɬ (Tsleil-Waututh) Nations. The author is grateful for access to the lands on which this work took place.
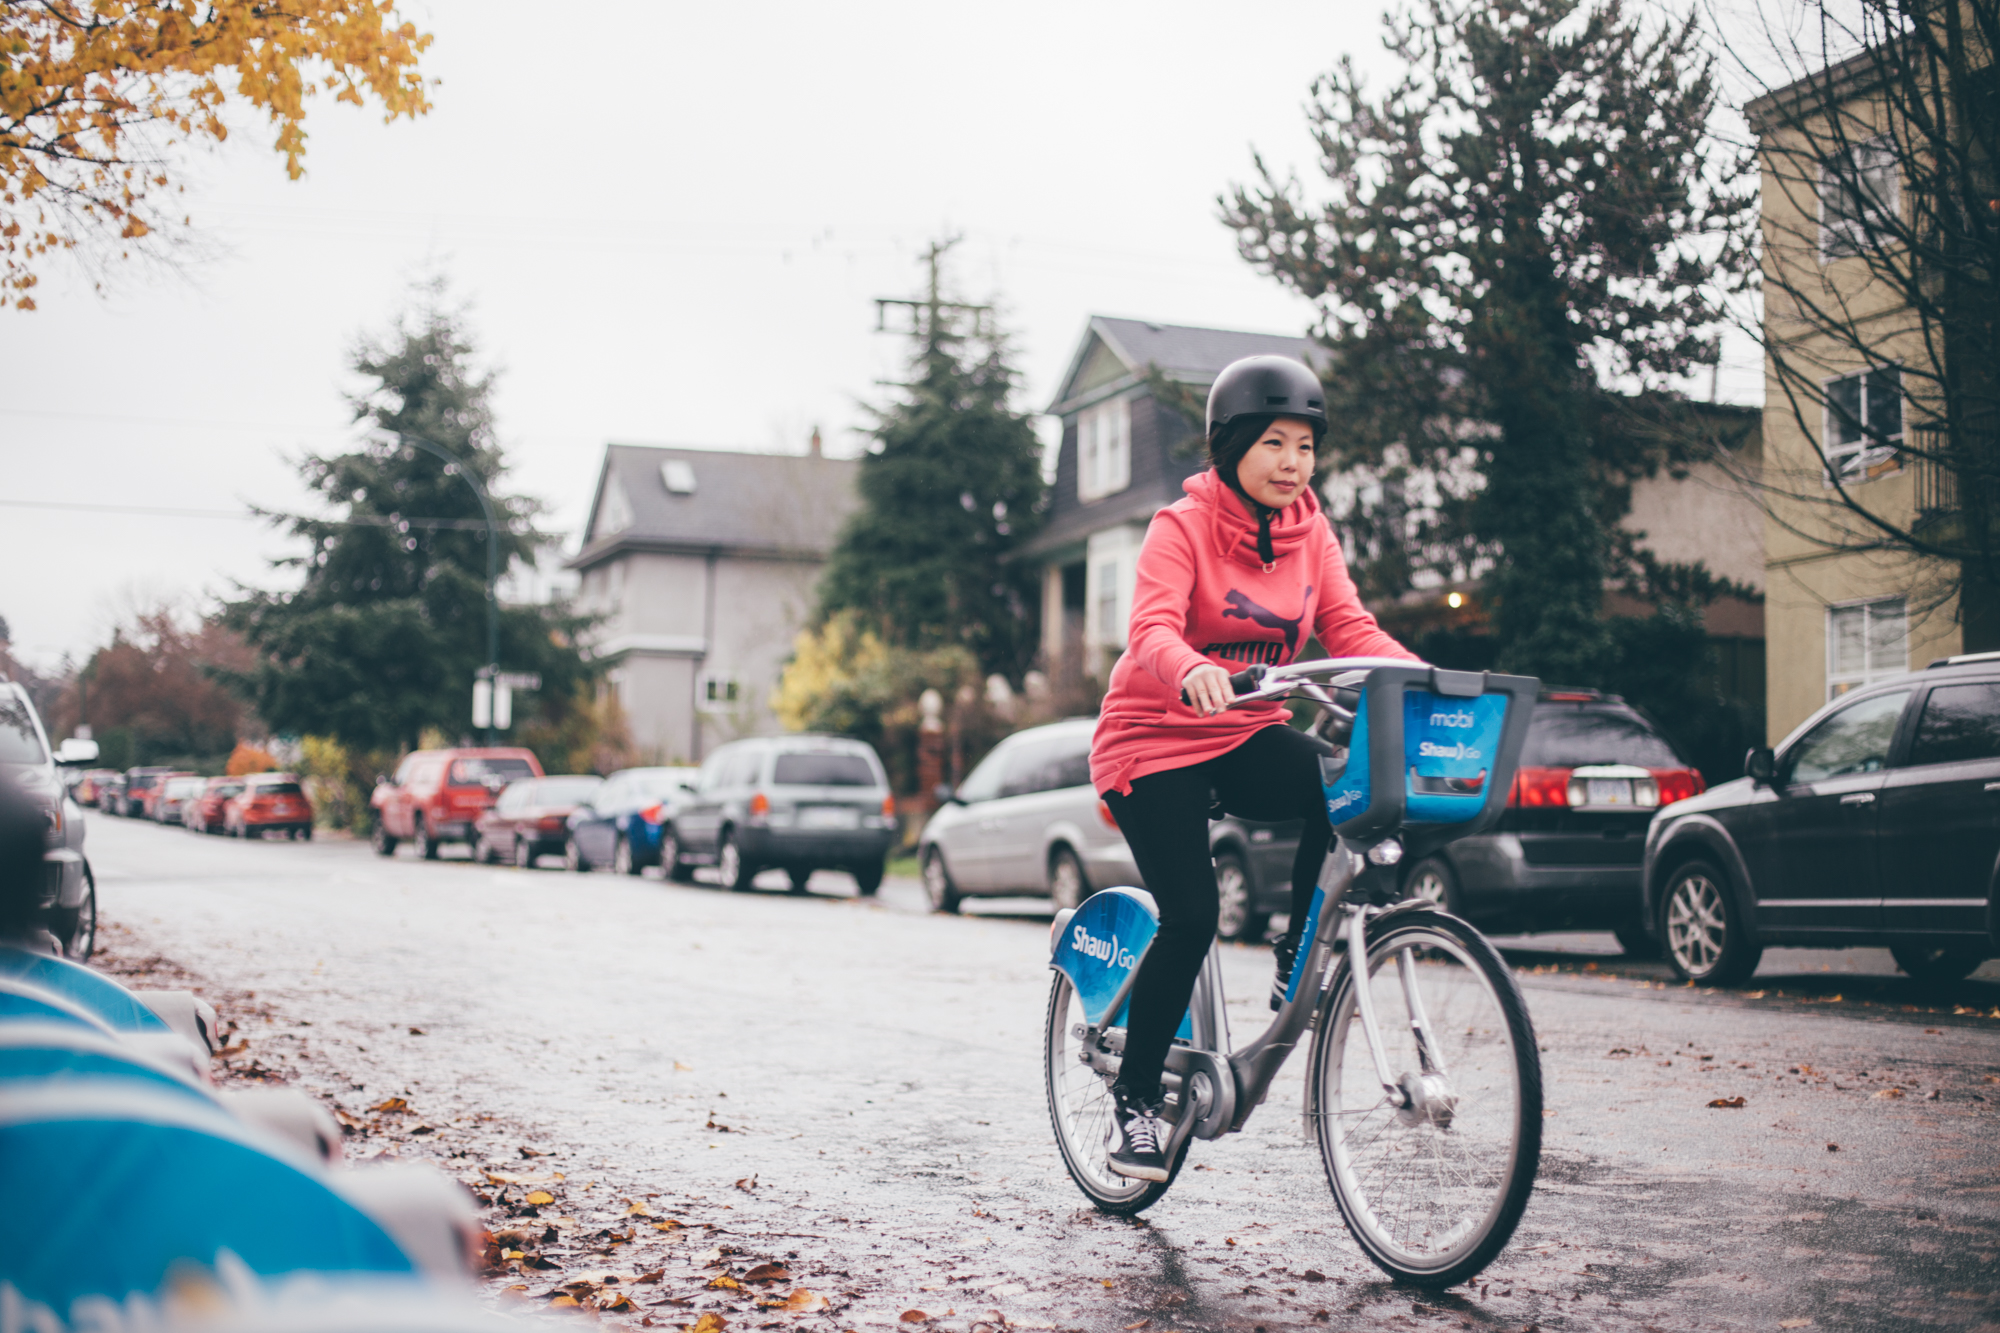
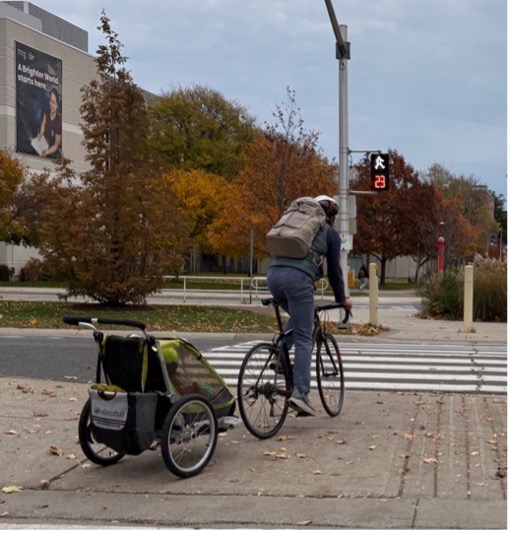
If you live in Vancouver or if you’ve visited the city in the last several years, you’ve likely noticed many cyclists riding Mobi by Shaw Go (Mobi) bikes; perhaps they’re cruising along the city’s popular seawall or rolling through the city’s downtown. You might have even seen me in the crowd! As a Mobi user, I enjoy the freedom and mobility that bike share offers because I have access to it; but not every resident in the City of Vancouver does. This is where our research comes in.
Bike Share Background
The City of Vancouver launched its bike share system in 2016 to provide people with a convenient and affordable mode of transportation for their daily trips. Docking stations were installed in the metropolitan core – the city’s highest density area – to reach the most people.
Since then, the City of Vancouver and Mobi have implemented numerous changes to reduce access barriers, such as extending the service area to a more diverse range of communities (Figure 1). Mobi expanded its network by adding 132 new docking stations, serving approximately 18% more of the city’s residents and covering an added land area of 19 km2.
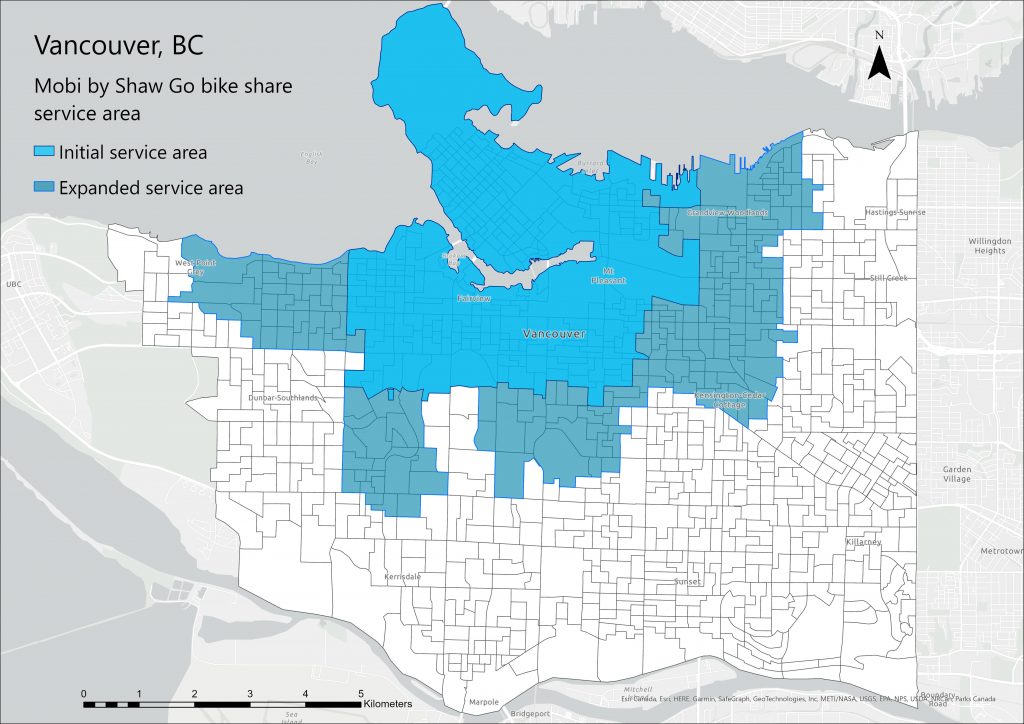
Figure 1. The initial and expanded bike share service area in Vancouver.
Our Research
Our team (Theme 2, Transportation Modes) conducted a socio-spatial analysis to evaluate whether the expansion of the service area from 2018-2022 resulted in a more equitable distribution of stations across the city.
This research is of personal interest. As an individual raised in a low-income, immigrant, single-parent household, the experiences I’ve had with transportation poverty[1] in my youth has shaped my keen interest in the topic. We know that individuals that experience more sociodemographic disadvantage[2], as well as equity-deserving populations3,[3] can achieve greater levels of overall health and well-being with better access to resources. For instance, accessible active transportation can foster improved physical and mental health, as well as social connectivity, while saving on individual traveling costs (Brown et al., 2019; Lee et al., 2017; Wang & Wen, 2017).
Therefore, our study measured whether the service area expansion achieved more equitable distribution for areas with higher levels of socioeconomic disadvantage and for equity-deserving populations, including racialized groups, immigrants, children, and older adults.
What We Found
Bike Share Access Based on Area-Level Sociodemographic Disadvantage
Today almost half of the city’s population has access to a bike share docking station (241 stations), and the service area covers approximately one-third of the total land area in Vancouver (38 km2). These findings are encouraging — an expansion of this scale has the potential to provide greater bike share access to a diversity of residents, including those experiencing transportation poverty. However, continued improvements are needed.
Overall, we found that access to Vancouver’s bike share service is substantially lower in
sociodemographically disadvantaged areas of the city. With the expansion, many new areas got access, some of which were more disadvantaged. However, the distribution of docking stations remains uneven (see dark blue in Figure 2). Areas in the south, east, and southeast of the city still don’t have access to the system. These areas tend to be more racialized and lower income.
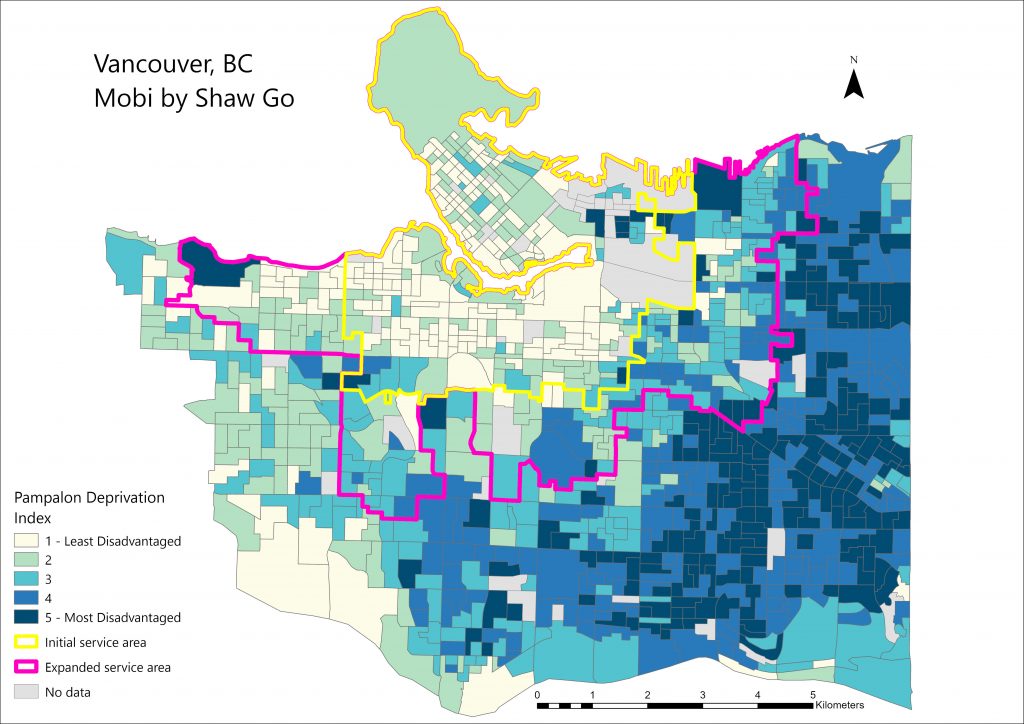
Figure 2. Access to the initial and expanded bike share service area based on sociodemographic disadvantage.
Public Bike Share Access Based on Equity-Deserving Population
Geographical access to public bike share for equity-deserving populations has also increased over time. We saw the greatest shift in access for Indigenous populations, including Indigenous women.
Yet, more efforts are required to advance socio-spatial equity in the city’s bike share system. For instance, a considerable proportion of equity-deserving groups still reside outside of the expanded service area (see Figure 3). Within the service area, access remains lower in areas with high numbers of these equity-deserving populations, particularly for visible minority[4], Filipino, and Chinese populations. We found that areas that had the highest proportion of visible minorities had the lowest access.
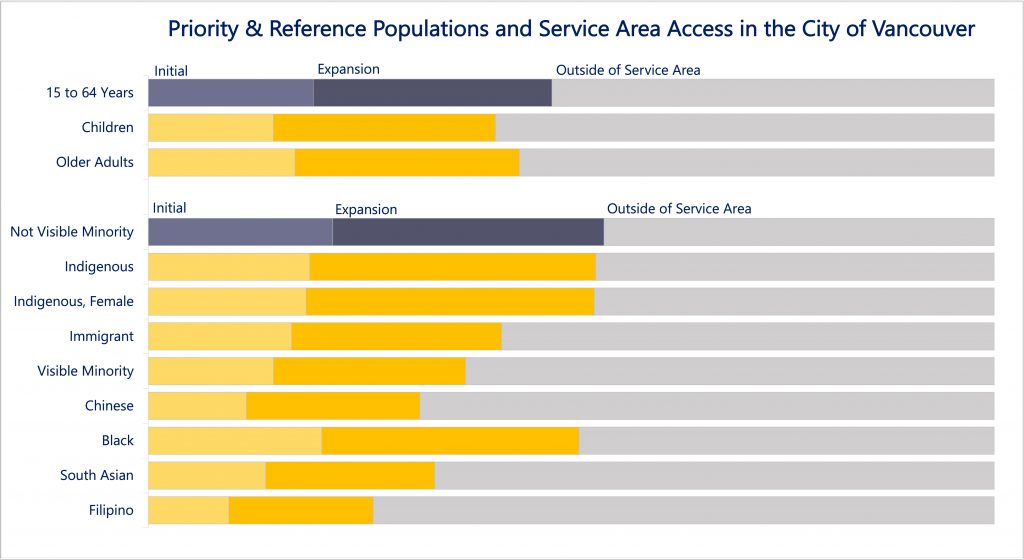
Figure 3. The proportion of each equity-deserving population inside the service area compared to the total population of each of these populations in Vancouver.
Looking forward: Identifying Opportunities for Equitable Expansion
Bike share programs have the potential to bridge gaps in a city’s transportation network and support active and sustainable transportation; however, the benefits of these programs are not always experienced equally across populations.
While the service area expansion has improved access to public bike share in Vancouver, continued efforts are required to understand and address the existing gaps in the system’s distribution. Extending services beyond the current system area boundaries into parts of the city where many of the equitydeserving populations reside, particularly in the south, east, and southeast regions of the city, certainly has the potential to make the system more equitable.
Reducing barriers to bike share access through other initiatives, such as Mobi’s Community Pass, is also central to improving access. The next phase of our research project will collect data on this front. In collaboration with the City of Vancouver and Mobi, our team will engage with community pass users and providers to make recommendations for improving the reach and success of the community pass program.
References
Allen, J., & Farber, S. (2019). Sizing up transport poverty: A national scale accounting of low-income households suffering from inaccessibility in Canada, and what to do about it. Transport Policy, 74, 214– 223. https://doi.org/10.1016/j.tranpol.2018.11.018
Brown, C., Deka, D., Jain, A., Grover, A., & Xie, Q. (2019). Evaluating spatial equity in bike share systems. https://doi.org/10.7282/T3–CS30–AD47
Lee, R. J., Sener, I. N., & Jones, S. N. (2017). Understanding the role of equity in active transportation planning in the United States. Transport Reviews, 37(2), 211–226. https://doi.org/10.1080/01441647.2016.1239660
Wang, L., & Wen, C. (2017). The Relationship between the Neighborhood Built Environment and Active Transportation among Adults: A Systematic Literature Review. Urban Science, 1(3). https://doi.org/10.3390/urbansci1030029
[1] Situations where socioeconomic marginalization, combined with poor transportation access, mutually reinforce barriers to opportunities and resources (Allen & Farber, 2019).
[2] Levels of social and material disadvantage relative to the community/society to which an individual belongs. We use three variables: average income, level of education, and employment, to measure the sociodemographic disadvantage of an area. 3 In this report we considered the following groups: children, older adults, those of Indigenous identity, including Indigenous women, immigrants, visible minorities, Black, Chinese, South Asian, and Filipino populations (the latter three being the largest groups of visible minorities in Vancouver by population size).
[3] Populations comprising individuals and communities with barriers to access, opportunities, and resources due to social and economic disadvantage and discrimination. 5 The full report is available here.
[4] According to Census Canada, ‘Not a visible minority’ includes persons who identified as White, that are not associated with a group designated as a visible minority (e.g., ‘Polish’, ‘Scottish’ or ‘Swedish’), that are a combination of White and not associated with a group designated as a visible minority, or that are a combination of White and: ‘Arab’, ‘Latin American’, or ‘West Asian’. ‘Not a visible minority’ includes persons who identified as First Nations, Métis and/or Inuit.
You may also like
 Making it safe, Making it work, and Making it fun: strategies for cycling with young children in Hamilton, Canada
Getting around by bike with young children is not always easy. Children are heavy, family schedules can be busy, and children often need to be… Read More
 What can we learn from a Bike Bus program in rural Nova Scotia?
There’s a revolution happening in the rural community of Hebbville, Nova Scotia (Mi’kma’ki) and it’s accompanied by a healthy dose of bike joy. Since 2020,… Read More
 Removing Fare Barriers: Free Public Transit for Youth Experiencing Homelessness in Toronto
Noah Kelly is the Director of Research & Partnerships at the Transit Access Project (TAP) and has recently completed his Master of Arts at McGill… Read More