Differences by Community Size: Reflections on the Survey of Local Elected Officials
Mobilizing Justice’s Theme 3 recently completed a survey of elected officials on transportation equity. In this blog post, University of Manitoba graduate student Abigail McLaren highlights differences in responses by city size.
I have had the pleasure of working as a graduate research assistant with the Theme 3: Equitable Community Planning and Engagement team. I have been helping with the survey aimed at understanding how elected officials view transportation equity as it relates to their community. In the summer of 2022, we distributed a survey to all mayors and councillors (local and regional) in Canadian jurisdictions with public transportation systems. The survey included 18 questions, 15 of which had an option to specify an “other” response. We found that the multiple opportunities for participants to add “other” responses resulted in many emerging themes, particularly for respondents from small and medium sized communities. The benefit of including “other” categories is that it allowed participants to expand on their unique successes and challenges in transportation investment and equity within their community. On the other hand, such variability increases the complexity of coding the responses, which could not be captured by existing question categories.
Community Size and Emerging Survey Themes
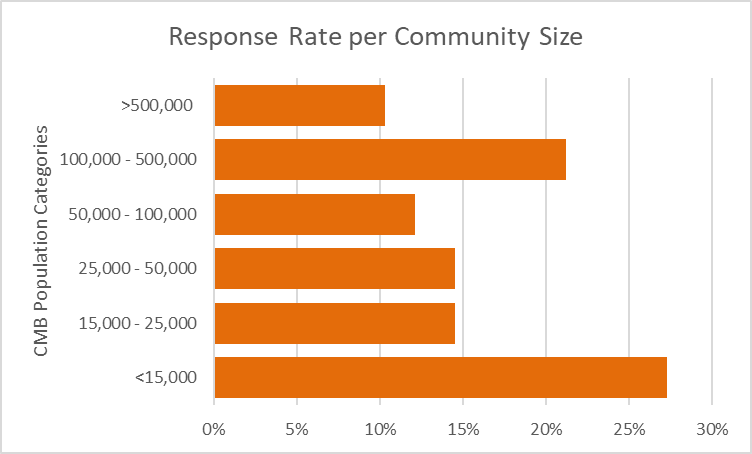
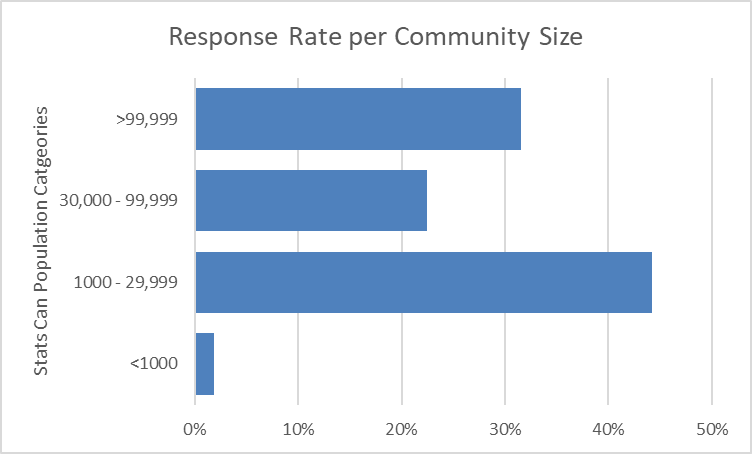
To better understand differences in different communities, we analyzed our survey responses by community size. Communities were categorized according to Canadian Municipal Barometer definitions[1], where the highest response rates were from communities of less than 15,000 people and 100,000 – 500,000 people. Comparing these to Statistics Canada classifications, 44% of our respondents represented a small community (1,000 to 29,000 people) and 32% represented large communities (larger than 99,999).
The most frequently noted themes included unclear, complex, or limited jurisdiction for transportation provision and servicing; need for regional and intercity transportation services; and negative attitudes and behaviours toward alternate transport methods. Another category that arose was “rural transportation issues”. Sometimes participants would leave it as generic response, yet other times would elaborate on what such an issue involves; for instance, they would link the transportation issue as a servicing challenge due to low population density across a large geographic area. These responses offer insight into challenges and opportunities for smaller communities that were not adequately covered by survey options.
Most elected officials noted that their information comes from their own research of transportation strategies successfully implemented by other cities.
Differing Responses from Small Communities
In the interest of keeping the survey as simple and time efficient as possible, the design assumed transportation successes and challenges were similar across communities of all sizes. For instance, several questions included pre-set responses categorized by mode; inquiring about how participants would allocate investment per mode, what barriers to equity existed per mode, and their personal experience per mode. When it came to the question regarding the most significant barriers elected officials believe people face in their jurisdiction, communities with populations less than 15,000 people and 25,000-50,000 people ranked “other” responses as the third and second most significant barriers, respectively. Some of these described barriers included lack of population density to support transit, an aging demographic, infrequent bus service, and lack of mode options apart from private vehicles.
When posed with the question “Is there anything else we should know about transportation decision-making in their communities?”, 35% of the “other” survey responses from elected officials in small communities focused on the limited power local governments have in transportation decision-making for their community. In some cases, public transit is provided and implemented at the provincial level with limited input from the serviced communities. Additionally, smaller communities do not have the resources to feasibly implement their own public transit service (indicated in 21% of responses from small-community elected officials), let alone those for regional and intercity travel. Conversely, in areas with developed regional transportation service and authorities, such as Metro Vancouver and the Greater Toronto Area, such issues would not exist at the same scale.
Apart from frequently mentioned jurisdictional issues, lack of regional service, and adverse attitudes towards alternate transport, another theme worth mentioning in the context of small communities’ responses are transit pilot projects. In some parts of Alberta and Southern Ontario, capital funding from the federal government has enabled smaller communities and regions without transportation alternatives to pilot on-demand transit or trial bus routes with smaller vehicles such as 14-person vans. Vying for available funding to invest in such a program suggests that elected officials in these smaller communities value transportation equity, despite reduced resource capacity compared to other municipalities or levels of government.
Conclusion
Being involved in designing a survey about understanding elected officials’ transportation equity values in communities of varying sizes across Canada has been an insightful process for me as a researcher. Creating one survey for elected officials all sizes of communities resulted in more complexities in the data than I would have initially expected, and for me, raises more questions as well as offers a lesson for future survey designs. The themes that arose from the research design indicate two interesting observations. Firstly, the survey results suggest that elected officials of smaller communities within Canada experience and prioritize transportation initiatives differently than those from large urban areas. Secondly, the responses from elected officials suggest that communities of all sizes are challenged by their funding and jurisdictional capacities and structures. As our team continues to analyze the survey results, discerning responses from elected officials of smaller cities compared to larger communities will determine strategic planning for follow-up interviews and case studies.
Recognition
Thank you to the Survey Research Centre at the University of Waterloo for the administration of the Survey of Local Elected Officials.
[1] See Canadian Municipal Barometer 2022: Data Summary (pg. 48). http://www.cmb-bmc.ca/wp-content/uploads/2022/02/cmb2022en.pdf
You may also like
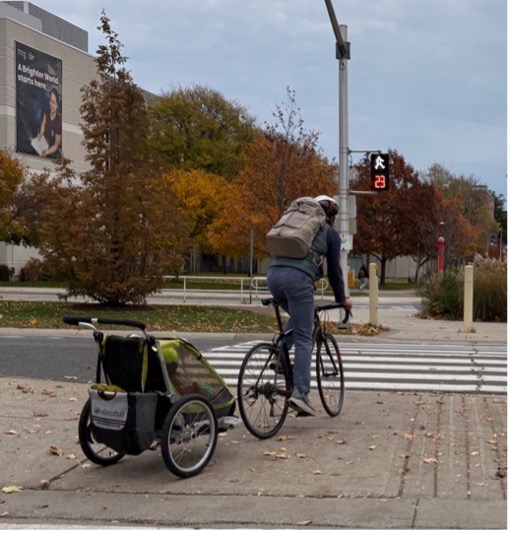 Making it safe, Making it work, and Making it fun: strategies for cycling with young children in Hamilton, Canada
Getting around by bike with young children is not always easy. Children are heavy, family schedules can be busy, and children often need to be… Read More
 What can we learn from a Bike Bus program in rural Nova Scotia?
There’s a revolution happening in the rural community of Hebbville, Nova Scotia (Mi’kma’ki) and it’s accompanied by a healthy dose of bike joy. Since 2020,… Read More
 Removing Fare Barriers: Free Public Transit for Youth Experiencing Homelessness in Toronto
Noah Kelly is the Director of Research & Partnerships at the Transit Access Project (TAP) and has recently completed his Master of Arts at McGill… Read More