How are the replacement buses doing on Queen and King streetcar lines?

Paromita Nakshi is a graduate student in Planning at the University of Toronto who researches transportation and social exclusion.
Motivation
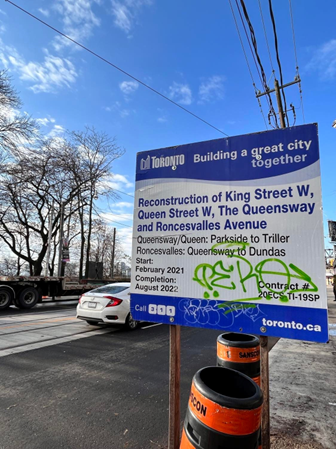
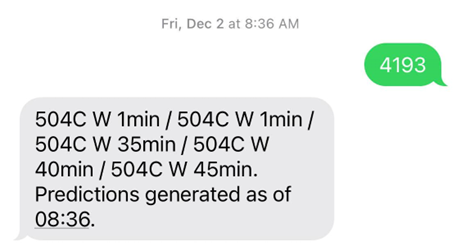
The motivation of this blog post came from my relocation to the west end of Toronto earlier this year. The replacement buses on Queen and King streetcar lines have been frequently running on new routes and taking new detours. There are new stops based on the detours and old stops are being ‘out of service’. All due to the ongoing construction work on the two streetcar lines that is going on for more than one year as of now. Beginning this fall along the west end of the city, these changes were so frequent that Google Maps, which I found till then good enough to get real-time transit information, was not able to keep up with the changes. That is when I started to rely on Toronto Transit Commission (TTC)’s Routes and Schedules on their website and text service to 898882 to receive estimated arrivals of next 5 vehicles (described below in detail). Unsurprisingly, TTC’s website and text service were almost always up-to-date with the frequent changes and real-time data. I found that the text service is particularly easy to use as it does not require any internet connection, the return texts with estimated arrivals of the vehicles are sent within seconds and they are quite accurate.
Why bother with replacement buses? They are temporary, right?
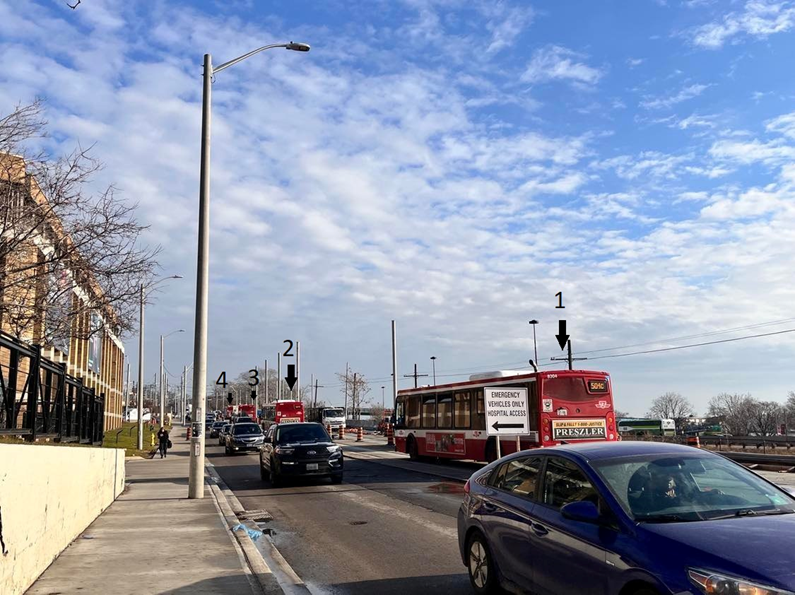
This blog post will concentrate on two replacement bus stops: King St West at Wilson Park Rd West Side (Stop no. 4193) serving 504C Westbound and Queen St West at Triller Ave (Stop no. 15341) serving 501L Eastbound. The 504C W has the terminal stop at Dundas West subway station and 501L E terminates at Dufferin Gate where riders transfer to 501 Eastbound to Neville Park streetcar. Therefore, both these replacement buses play an important role in connecting riders to other mass transit services and consequently, with the rest of the city.
Although I am focusing on only two stops along these replacement bus lines, I think this can offer important insights for future research and planning because (1) it allows us to see a reasonably detailed picture over a couple of months without getting too overwhelmed with tons of information (2) in Bringing our attention to the replacement buses along these two streetcar lines also allows us to understand the reliability of the replacement bus services in Toronto, which often do not get much attention because they are by definition, temporary in nature. At the same time, these two streetcars serve several neighborhoods in the west end of the city (e.g. Parkdale, Roncensvalles, Liberty Village, Trinity Bellwoods, Beaconsfield Village, Little Tibet, etc.) that are not accessible to any existing subway stations by walking or driving. Therefore, residents are highly dependent on the reliability of these replacement buses to reach their destinations including downtown offices and universities. Hence, although they are temporary measures, a large segment of the city population is undoubtedly affected by the reliability of these buses for over a year. ‘Temporary’ is not so temporary, after all!
Approach
The findings presented here is the output of my regular observation and usage of the replacement buses 504C Westbound and 501L Eastbound for the 2 months (mid October to mid December). I have been regularly using the text service to 898882 to get real-time bus arrival updates. My frequent observation of waiting for the buses longer than expected led me to the curiosity to compare how the estimated arrival times fared against the actual schedule.
So, anything presented here should be primarily viewed from the rider perspective, which I think is reasonable since the ultimate goal of transit is to serve the riders as best as possible. At the same time, transit reliability is often considered as one of the top priorities in transit service. However, what transit agencies consider satisfactory does not always align with riders’ experience. In fact, research suggests that a minute of waiting time may be perceived as almost double by a rider in some cases (Fan et al., 2016). As a transportation planning researcher and transit enthusiast, I used a few basic tenets of transportation to analyze certain observations in this post.
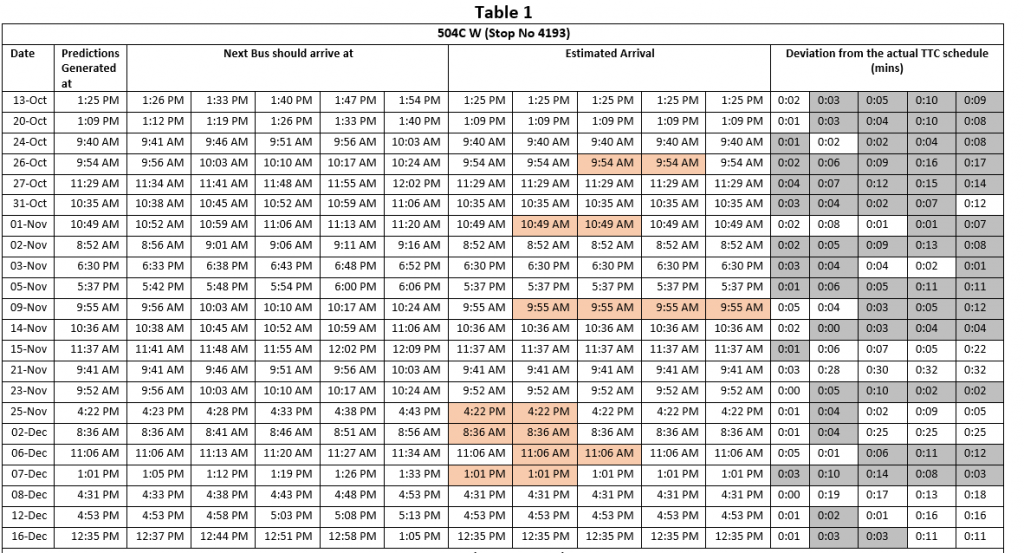
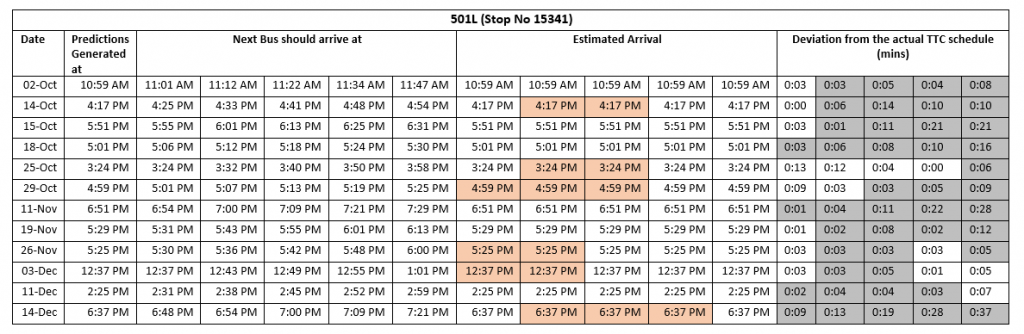
TTC’s text service allows the riders to text any particular bus or streetcar stop number to 898882 and receive next 5 estimated arrival times of bus or streetcar at that stop. I compared the real-time text updates with the schedules provided on TTC’s website. For instance, the ‘Predictions Generated at’ column reflects the time when a rider arrives at the stop and sends the text. Usually, the updates arrive within seconds. The text looks like Figure 2. The estimated arrival times were calculated for the next 5 buses by adding these times to the ‘Predictions Generated at’ times. The ‘Next bus should arrive at’ was derived from TTC website’s Routes and Schedules. These are the next 5 arrival times beginning from the time the rider arrives at the stop (the ‘Predictions Generated at’ time). The ‘Deviation from Actual TTC Schedule’ were calculated by taking the consecutive difference between ‘Next Bus Should Arrive at’ and Estimated Arrivals times. The gray shaded cells show when a bus was early than its scheduled time. The orange shaded cells show bus bunching phenomenon where two or more buses arrive at a stop at the same time.
Findings and discussion
TTC website shows that on weekdays, the 504C replacement bus has a scheduled headway (time interval between two consecutive buses) of minimum 4 minutes and maximum 10 minutes depending on the time of the day. On weekends, the headway ranges from 6 minutes to 16 minutes. The weekday headway of 501L replacement bus ranges from 6 minutes to 14 minutes and the weekend headway from 6 minutes to 20 minutes.
In reality, as table 1 shows (linked here or see below), the buses were not nearly able to adhere this schedule. Buses were estimated to arrive as much as more than 30 minutes late. Even if we assume that such extreme delays are rare events, buses arriving more than 5 minutes late or early is a regular phenomenon. More than 10 minutes deviation is also surprisingly common which basically overlaps with the scheduled headway in certain time periods. Bus bunching is also a regular occurrence which practically renders all but the first bus mostly useless. This is also a huge waste of resources and accompanies with long waiting time at the stop.
The gray shaded cells show that buses arrived early in a significant number of times. It is possible that either the bus was running hot (early compared with its actual schedule) or it was actually running late and should have arrived at a previous point of time instead of the later one. However, from a rider perspective, the potential underlying reasons do not matter a lot. What matters is how much time they have to wait for the next bus and how that affects their trip planning and activity scheduling. Nobody wants to wait 15+ minutes when the schedule says that the next bus should arrive in 7 minutes. Similarly, nobody likes to see that the bus left 3 minutes before the scheduled time. Such deviation from the schedule can make it difficult for people to plan their trips or leave them waiting for the bus in adverse weather condition for a long time. People travelling with toddlers or carrying groceries, people with disabilities and senior citizens are more likely to suffer in such situations. Significant delays can also mean missing the free 2-hour transfer window for some people and consequently, paying more than anticipated. Thus, in parts of the city that are not directly served by the subway lines, reliability of streetcars and therefore, replacement buses can be crucial for the overall quality of life.
The purpose of this post is not to provide a rigorous methodology or comprehensive overview on this matter. Rather the purpose is to analyze some observations based on real-time data. This analysis should not be considered as conclusive and generalized. Transit reliability is a complex and nuanced topic. This is only a small snapshot of a much larger and unarguably complex picture. Yet, this disaggregated picture shows that significant attention is needed to improve the city’s surface transit reliability. TTC’s performance score card shows only a highly aggregated picture with the sole indicator of surface transit reliability being ‘on time departures from end terminals’ and measured as the % of service that departs from the end terminal between 1 minute early and 5 minutes late of the scheduled time. Such aggregation is problematic and does not provide much useful information. This does not reflect variability across different routes and takes into account only the end terminals. What about a bus arriving 5 minutes late at each of two stops and arriving 3 minutes early at each of 2 stops? Blurring out all the necessary information of the in-between stops where the bus was not ‘reliable’ enough from the rider perspective is not particularly useful. As we saw for 504C W and 501L E buses, buses hardly arrived within the ‘1 minute early and 5 minutes late’ range. Thus, there is an indication that reliability at in-between stops might be even lower than the metric TTC is presently using.
This analysis is also based on ‘when will the bus arrive?’ and not ‘when did the bus arrive?’. The former certainly has caveats because arrival times can change dynamically and therefore, the estimated arrivals and deviations might not be an exact representation of the reality. Yet, it can be reasonably said that high deviations from the schedule at one stop and one point of time is likely to promulgate over time and at subsequent stops, even if the deviation gets reduced to some extent.
So, what next?
The status quo will be completely different once the Queen and King streetcar tracks are completed and the streetcars start running on their full route. However, the City of Toronto and TTC can use this experience for improving similar situations in the future. Faster completion of road/track construction work will help reduce operational issues associated with replacement buses to a large extent.
Surface transit, if running with mixed traffic, will inevitably be dependent on circumstances beyond its control. The headways should be determined taking into account some potential delays for all surface transit including replacement buses. For instance, historical stop-level transit arrival data might show which stops and links are more affected by traffic congestion. Then schedules should reflect that by adding appropriate amount of slack time. That will reduce waiting time for riders and enable them to better plan their trips and activities. At the same time, too much slack time can have adverse impacts by reducing the service frequency. Therefore, finding an optimum, realistic slack time which is sensitive to individual links and stops might be an avenue to pursue.
The King Street pilot project demonstrated significant travel time reduction (Harris & Spur, December 4, 2017). Steve Munro has recently published in his blog an update of the King Street travel times between Bathurst and Jarvis Streets (Munro, December 18, 2022). Palm et al. (2020) conducted a study on equity of bus on-time performance in Toronto where they used terminal departure data based on TTC’s standard of service reliability. These studies, however, did not study individual stop-level reliability. Steve Munro recently did a detailed stop-level service analysis of 63 Ossington bus for the month of November where he used Marey Diagram to show the movement of vehicles on selected days. Such diagrams are extremely helpful to understand where and when the buses are moving slower or faster and if any bus bunching happens. Although he did not compare the existing scenario to actual schedules. I think similar analysis for other bus and streetcar lines using historical data and then comparing them with actual schedules will be a great first step to address surface transit reliability issues. TTC should also move towards more disaggregated metric of reliability analysis. That will create more transparency and build trust among the riders. ‘Meaningful’ metrics will also allow transit planners and engineers to develop actual solutions.
Should we also think about dedicated right-of-way for the streetcars with transit signal priority in all the lines to reduce the effect of some of those external factors? I strongly believe that the City of Toronto and TTC should consider such initiatives to improve reliability, increase ridership and decrease car dependency in the post-pandemic era.
References
Fan, Y., Guthrie, A., & Levinson, D. (2016). Waiting time perceptions at transit stops and stations: Effects of basic amenities, gender, and security. Transportation Research Part A: Policy and Practice, 88, 251-264.
Harris, T & Spur, B. (Harris & Spur, December 4, 2017). King St. pilot project has slashed streetcar travel times, statistics show. Retrieved from https://www.thestar.com/news/gta/transportation/2017/12/04/king-st-pilot-has-slashed-streetcar-travel-times-stats-show.html on December 19, 2022
Munro, S. (December 18, 2022). King Street Travel Times: Fall 2022 Update. Retrieved from https://stevemunro.ca/2022/12/18/king-street-travel-times-fall-2022-update/ on December 19, 2022
Palm, M., Shalaby, A., & Farber, S. (2020). Social equity and bus on-time performance in Canada’s Largest City. Transportation Research Record, 2674(11), 329-342.
Appendix
View a larger version of Table 1 here.
You may also like
 Making it safe, Making it work, and Making it fun: strategies for cycling with young children in Hamilton, Canada
Getting around by bike with young children is not always easy. Children are heavy, family schedules can be busy, and children often need to be… Read More
 What can we learn from a Bike Bus program in rural Nova Scotia?
There’s a revolution happening in the rural community of Hebbville, Nova Scotia (Mi’kma’ki) and it’s accompanied by a healthy dose of bike joy. Since 2020,… Read More
 Removing Fare Barriers: Free Public Transit for Youth Experiencing Homelessness in Toronto
Noah Kelly is the Director of Research & Partnerships at the Transit Access Project (TAP) and has recently completed his Master of Arts at McGill… Read More