How the Canadian population gets to work
In this post Meghan Winters, Academic Lead of the Transportation Modes Theme, and Kate Hosford, PhD Candidate at Simon Fraser University, provide a snapshot of the 2016 census journey to work mode share data stratified by gender, age, income, race, and geography.
February 22, 2022
National data on how people move around their cities is useful for researchers and practitioners to describe transportation patterns, understand who is using which travel modes, and identify longer-term trends in travel across populations. Unfortunately, unlike our neighbours down south and many other countries around the world, Canada does not have a national household travel survey.
Researchers have called for a national travel household travel survey, but until then, the journey to work mode share data from the Canadian census is the most comprehensive routinely collected travel data we have. Journey to work mode share data is just a single question. It tells us about the mode a commuter typically uses to get to work – that is, the one they use most days of the week.
Responses are limited to a single mode – drive, transit, walk, bicycle – that they use for the majority of the trip distance. This masks the fact that people may use multiple modes for commuting, such as driving or walking to connect to transit. This limitation was addressed in the most recent 2021 census through the addition of a new question that asked respondents to select all the modes they usually use to commute to work, in addition to identifying their main mode.
And finally, this national transportation data limits insights to only work trips – excluding trips made by those who aren’t in the workforce and trips made for other purposes. As of 2016, 40% of the Canadian population is in the workforce and commutes to work. This number is likely even lower now in the context of the pandemic where many workers lost their jobs and many others shifted to working from home.
While some people may have a multitude of transportation modes to choose from to get to work, others do not. Travel mode choice may be constrained by distances, the availability of transit services or cycling infrastructure, personal resources, division of household labour, or other factors.
Researchers and practitioners commonly disaggregate transportation data by demographic and geographic characteristics to understand who is using which modes, to identify structural inequities in transportation systems, and to measure progress towards goals to reduce inequities.
In this post we provide a snapshot of the national journey to work mode share data from the 2016 census, disaggregated by gender*, age, income, race**, and geography. We analyzed the data from the 2016 Census Public Use Microdata Files (PUMF), which is anonymized, non-aggregated census data provided by Statistics Canada. We include the data supporting each figure at the end of the blog.
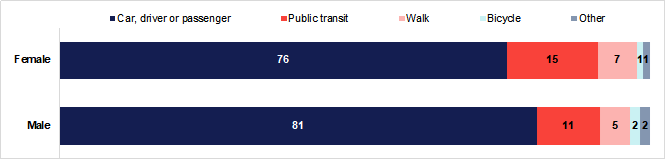
Journey to Work Mode Share by Gender
We see that compared to women, men are more likely to drive and cycle to work, and less likely to take public transit or walk.
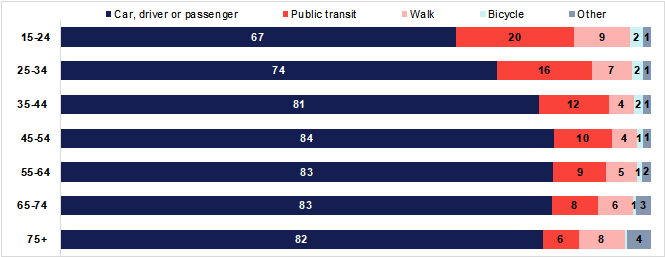
Journey to Work Mode Share by Age
We see that older workers are more likely to drive than younger workers, and less likely to take public transit, walk, or cycle. One third of commuters under 25 use sustainable transportation modes, while only about one-sixth of commuters do in the older age groups.
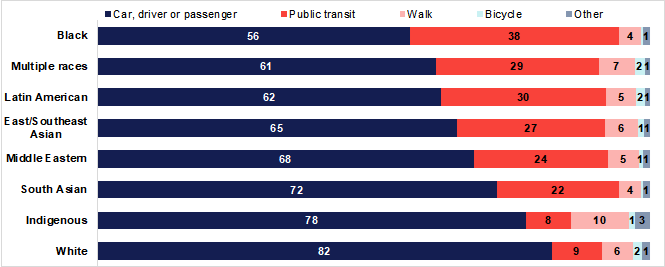
Journey to Work Mode Share by Race
Relative to all other groups, White commuters most commonly drive to work (82% of commuters). Public transit mode share is considerably lower for White and Indigenous populations (8-9% of commuters) compared to other populations. Black commuters stand out with a public transit mode share four times greater (38% use transit as their main mode).
Indigenous populations are the most likely to report walking to work as their usual mode, with a walk mode share of 10%. Those who identified as Mixed Race, Latin American, or White had the highest bicycle mode share (2%). Walking and cycling is less commonly reported by Black and South Asian commuters.
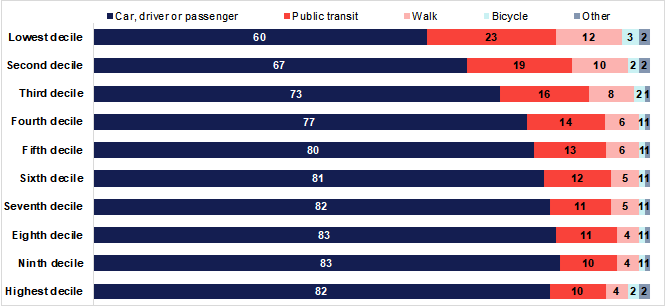
Journey to Work Mode Share by Income
There are clear patterns in journey to work mode share across income groups. The proportion who usually drive to work steadily increases with income: only 60% of commuters in the lowest income decile drive, while 82% of commuters in the highest income decile drive. Commuters with lower incomes more commonly rely on public transit, walking, and cycling.
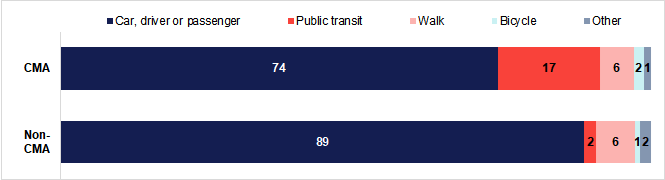
Journey to Work Mode Share by Geography
The availability of public transit and supportive walking and cycling environments varies widely across geographic contexts. About seven in ten (71%) of Canadians live within a Census Metropolitan Area, which are areas that consist of one or more neighbouring municipalities around an urban core – such as the Greater Vancouver region. As expected, driving to work is more common for those living outside a metropolitan area than for those living inside. Notably, the difference is essentially driven by a lack of public transit: only 2% of residents who live outside of a metropolitan area take public transit to work, compared to 17% within metropolitan areas.
Coming next: an intersectional approach
This first blog looked at transportation patterns by gender, age, race, income, and geography one by one. However, intersectional approaches underscore that these categories do not exist on their own, but rather intersect with each other to create distinct social experiences.
For example, a recent study in Montreal found that women were more likely to make household and caregiving trips as compared to men. However, when the researchers also considered income, they found that as household income increased, the division of care trips became more equal between men and women. This points to structural factors that create distinct experiences for women with lower incomes compared to women with higher incomes.
In our next post we will explore how journey to work mode share data varies across intersections of gender and age, race, income, and geography.
Journey to Work Mode Share Data, 2016 Canadian Census, overall and by gender*, age, race**, income, and geography.
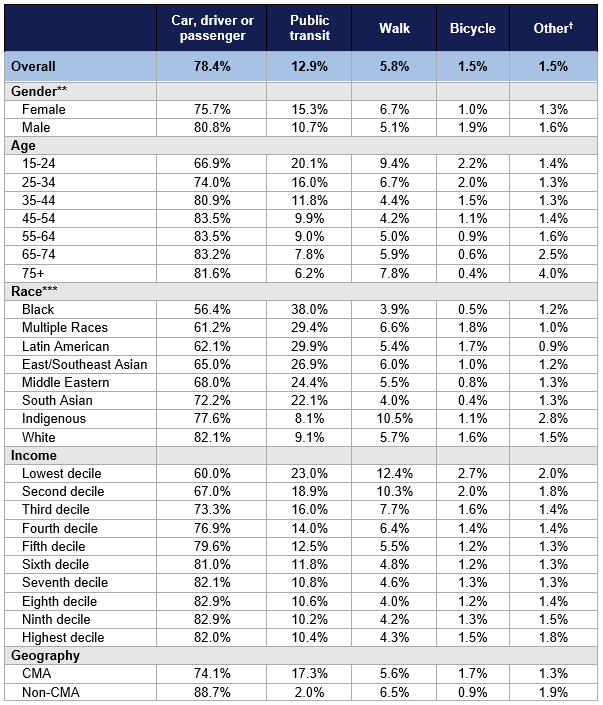
†Other includes passenger ferry, motorcycle, scooter, moped, and other modes not listed in the census.
*The 2016 census collected data on “sex” which only included the binary response categories of Male and Female. The 2021 census was updated to include an additional question on gender, that included a non-binary response option.
**More information on race data collected in the Canadian census can be found here.
Note: For some records in the PUMF, responses were changed to ‘Not available’ to protect the identity of the respondent. Therefore, there are slight differences in the journey to work mode share results reported in this post, as compared to results published by Statistics Canada.
Reference
Statistics Canada, 2019, “2016 Census Public Use Microdata File (PUMF). Individuals File”, https://hdl.handle.net/11272.1/AB2/GDJRT8, Abacus Data Network, V1
You may also like
 Making it safe, Making it work, and Making it fun: strategies for cycling with young children in Hamilton, Canada
Getting around by bike with young children is not always easy. Children are heavy, family schedules can be busy, and children often need to be… Read More
 What can we learn from a Bike Bus program in rural Nova Scotia?
There’s a revolution happening in the rural community of Hebbville, Nova Scotia (Mi’kma’ki) and it’s accompanied by a healthy dose of bike joy. Since 2020,… Read More
 Removing Fare Barriers: Free Public Transit for Youth Experiencing Homelessness in Toronto
Noah Kelly is the Director of Research & Partnerships at the Transit Access Project (TAP) and has recently completed his Master of Arts at McGill… Read More