When colleagues doubt that equity matters—Lessons from ALDTREC
In this post, our Research Coordinator Matt Palm draws on evidence from ALDTREC, A Living Database of Research on Transportation Equity in Canada, to discuss evidence on some of the inequities that exist within Canada’s transportation system.
As researchers committed to transportation equity, we are sometimes challenged to “prove” that inequities or injustices exist within Canadian transportation planning. This blog details three examples, backed up by multiple studies from across the country, of inequities within Canadian transportation systems.
The three examples were identified from ALDTREC, A Living Database of Research on Transportation Equity in Canada. We created ALDTREC to help ourselves and others grapple with the large amount of evidence relevant to understanding transportation (in)equity in Canada. It’s called a “A Living Database” because we know we don’t have every study, podcast, or report out there, and we will maintain and expand on this database as we grow. Don’t see your paper/podcast/article? Submit your work here! ALDTREC is meant to be a living resource for advocates, researchers, community members, and government to draw upon and contribute to.
Here we have used ALDTREC to detail examples of inequities in Canadian transportation, backed by research evidence:
1. Racialized Canadians are more exposed to transportation-related air pollution than white residents. People with low incomes are also more exposed than people with high incomes.
Pinault et al modeled who in Canada is exposed to PM 2.5, a pollutant that causes lung irritation and can worsen asthma and heart disease. Motor vehicles are a major source of PM 2.5, making our roads and highways dangerous for our lungs. Using 2006 data, they report that nationwide, visible minorities* are more exposed to PM 2.5 compared to white residents. Within urban cores, they also demonstrated that people with lower incomes are more exposed to this harmful pollutant than people with higher incomes. More recent research by Giang and Castellani expand on these findings. They add that Indigenous people and residents with low incomes in Vancouver, newcomers and racialized people in Montreal, and residents with low incomes in Toronto, all experience higher levels of air pollution relative to other groups.
Those studies looked at all sources of pollution, not just transportation. But in Montreal, Carrier et al found that visible minority* residents and residents with low incomes were more likely to live near highways and major roads, and thus were exposed to higher levels of PM 2.5. These groups were also exposed to other harmful air pollutants generated by road traffic that are collectively called NOx, for Nitrogen Oxides. A study by Sider et al found similar patterns. The authors constructed an index of neighbourhood disadvantage and compared the index against transportation-related air pollution (TRAP). They conclude that communities experiencing disadvantage are not only more exposed to TRAP, but further, that they emit far fewer pollutants relative to what they are exposed to.
Evidence that residents with low incomes and racialized people are systematically more exposed to transportation-related air pollution is strong. This makes addressing this pollution a matter of social equity and environmental justice, as these groups bare a disproportionate burden of Canada’s transportation pollution.
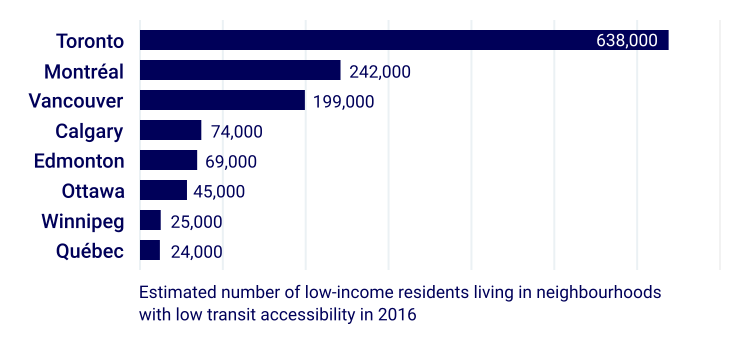
2. Up to 1.3 million Canadians on low incomes live in neighbourhoods with inadequate transit service, and this number is likely growing.
The benefits of public transit are frequently measured in terms of how many destinations people can reach using that mode. For example, researchers might measure the number of jobs you could reach from your neighbourhood within 45 minutes by transit. Using this kind of metric, researchers at McGill found that Canadian transit agencies have, on average, provided better transit access to people with lower incomes compared to the population overall.
However, Allen and Farber report that up to 1.3 million people in Canada earning below the Low Income Measure, a threshold for poverty, live in neighbourhoods with low transit access to jobs. In a related study focusing on the Greater Toronto Area (GTA), these authors demonstrate that when people with low incomes in transit-poor areas do not own vehicles, they participate in fewer daily activities compared to similar households in neighbourhoods with better transit access. Thus these 1.3 million people may be at risk of experiencing transport poverty: an experience wherein having a low income and lacking good transportation become mutually re-enforcing challenges. In a subsequent study, Allen and Farber illustrate that the number of people on low incomes who live in areas with poor transit accessibility grew significantly between 1991 and 2016 in the GTA.
Over a million Canadians live in neighbourhoods where a lack of public transit may reduce how much they are able to do, harming their ability to participate fully in society.
3. Cycling infrastructure investments are not distributed equitably.
Bike Score is a proprietary tool measuring the bicycle-friendliness of neighbourhoods. Fuller and Winters modeled the relationship between neighbourhood incomes and Bike Scores across eight Canadian cities. They provide robust evidence that across the nation, neighbourhoods with higher incomes had higher Bike Scores and higher Bike Lane Scores, which measure the presence of bike lanes, bike paths, and protected bicycle lanes.
Cities have been investing in new bicycle infrastructure. Canadian research has started to look at which neighbourhoods receive investments, which do not, and how this has changed over time. Houde et al tracked investments in cycling in and around Montreal over 25 years. They concluded that neighbourhoods with more children were less likely to have cycling infrastructure, a disparity that persisted even after 25 years of investments. On a positive note, they found that areas with more newcomers and older adults saw improvements, while people with low incomes had consistently good levels of access to cycling infrastructure. Firth et al. tracked investments in bicycle infrastructure in Vancouver between 2001 and 2016. They found a disproportionate lack of access to this infrastructure – in particular to protected bicycle lanes – in areas where more children lived and where more residents were of Chinese ancestry, the largest racialized population in the city. These inequities persisted even after the city added 150 kilometers of new cycling infrastructure.
The provision of cycling infrastructure is uneven across Canada, with differences between groups varying by city and dependent on the scale of analysis (national versus regional). Regardless, evidence is emerging from within two of Canada’s cities that children have less access to this infrastructure, reducing their ability to safely participate in cycling.
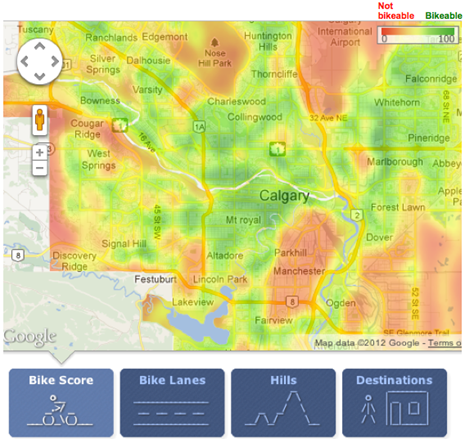
Figure 2: An example of Bike Scores Across Calgary, from ChatrLab
*Visible minorities is the term used here as it reflects the term used in the referenced study.
You may also like
 Making it safe, Making it work, and Making it fun: strategies for cycling with young children in Hamilton, Canada
Getting around by bike with young children is not always easy. Children are heavy, family schedules can be busy, and children often need to be… Read More
 What can we learn from a Bike Bus program in rural Nova Scotia?
There’s a revolution happening in the rural community of Hebbville, Nova Scotia (Mi’kma’ki) and it’s accompanied by a healthy dose of bike joy. Since 2020,… Read More
 Removing Fare Barriers: Free Public Transit for Youth Experiencing Homelessness in Toronto
Noah Kelly is the Director of Research & Partnerships at the Transit Access Project (TAP) and has recently completed his Master of Arts at McGill… Read More