The Average Price of Single-family Detached Homes in Different Communities along the Eglinton Crosstown Light Rail Transit
Introduction
There has been a boom in light rail transit (LRT) construction across North American cities in the past few decades. Such transit infrastructure investments can have a significant influence in facilitating community-level socioeconomic and demographic changes. On the one hand, government investment in rapid transit (e.g., LRT) and transit-oriented land use planning can improve the accessibility of local public transportation systems for urban residents, including marginalized and racialized communities with respect to commuting for jobs, utilizing healthcare services, among others (Allen & Farber, 2021; Yousefzadeh Barri et al., 2021).
On the other hand, given improved transit accessibility, as well as enhanced environmental qualities realized through TODs (e.g., walkable neighborhoods), previous research has generally found that people are willing to pay extra to live in the locales nearest to transit infrastructure (Higgins & Kanaroglou, 2016). In this way, transit infrastructure potentially contributes to urban transformations such as gentrification and residential displacement in areas utilized for transit-oriented development (TOD) (Delmelle, 2021).
This has raised concerns regarding the economic prospects of local businesses owned and operated by low-income and ethnic minority groups who may be priced out of their communities. For instance, in terms of pricing out, there have been very strong concerns that the new Eglinton Crosstown LRT, in Toronto, Ontario, is facilitating gentrification processes through a loss of dozens of Black businesses and Black homeowners in Little Jamaica, a Black community in Toronto. You can read more here and here.
Given these concerns, I was very curious to explore the socioeconomic characteristics and dynamics along the Eglinton Crosstown LRT line through two methods. First, I identified the community type around each LRT station. Community type is defined here as the concentration of Visible Minorities (VM) in each LRT station area using data from the 2016 Canadian Census of Population. The origin of the term Visible Minority is credited to Toronto Black activist Kay Livingston, and includes anyone who is “non-white in color/race, regardless of place of birth.” This term is also applied by the government of Canada using the Employment Equity Act to identify and address racial inequality.
Second, I searched for the average price of single-family detached homes located within these identified station communities using recorded real estate transactions. I focus on single-family detached homes as they were the most transacted residential property in the study area. Average prices are determined for the following phases of the LRT project: the announcement phase (2007 Q1 to 2011 Q3) and construction phase (2011 Q4 to 2016 Q2) – each period equals 4.75 years for consistency.
To be clear, this article does not causally attribute the observed average prices in the station communities, as well as the changes in prices across project phases, to the presence of the Eglinton Crosstown LRT (that is a topic I am pursuing through my Ph.D. studies). Instead, driven by curiosity, my analysis here highlights the need to consider different community types and potentially uneven impacts arising from planning initiatives such as transit investment.
Identification of Community Type at Different Stations
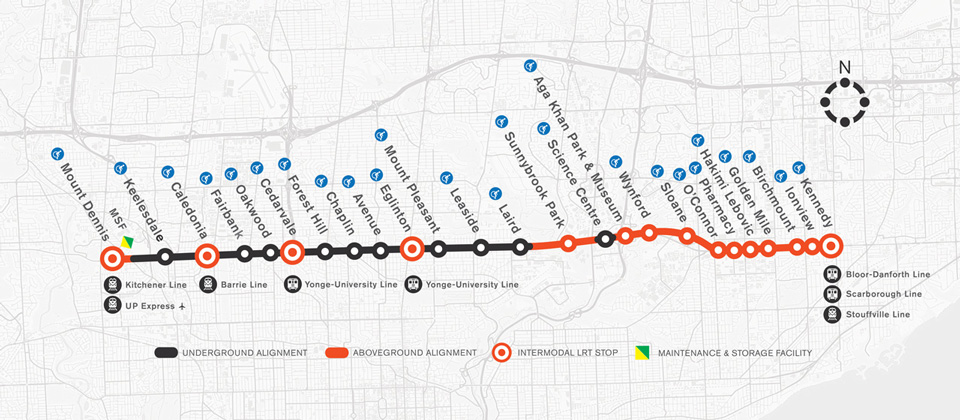
A station community is operationalized as a 10-minute walking zone around a station. The literature often adopts this definition (or 800m buffer zone) to represent how far a person is willing to walk to a transit station. Station communities may, however, overlap as multiple stations can be reached within a 10-minute walk along the LRT route – I do not consider this as problematic as stations near each other are likely to be in communities that share similar demographic characteristics such as race and ethnicity.
To determine the concentration of VMs, the 10-minute walking zones were intersected with the census profile data at the Dissemination Area (DA) level through an areal apportionment analysis.
From this, I was able to estimate the level of concentration of VMs in each station community, and subsequently classify each station as one of these three typologies:
- High Presence of VM (More than 50% of total station community population identify as VM)
- Medium Presence of VM (Between 35% to 50% of total station community population identify as VM)
- Low Presence of VM (Less than 35% of total station community population identify as VM)
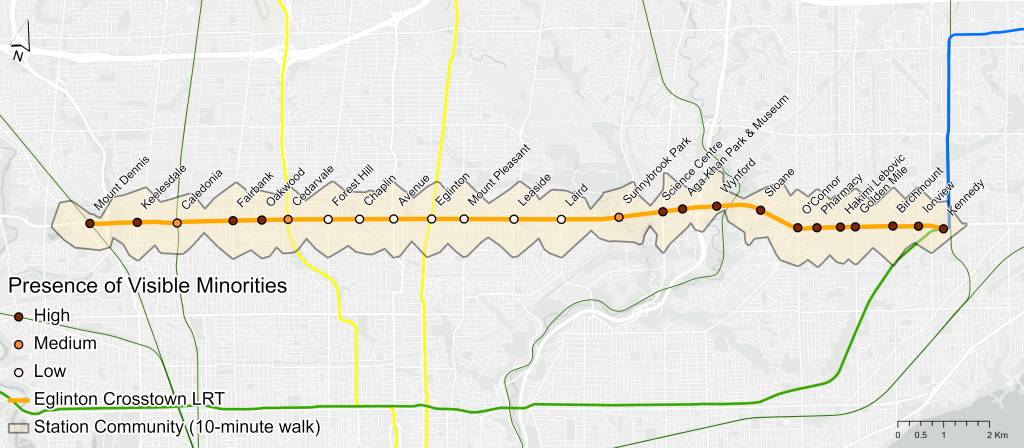
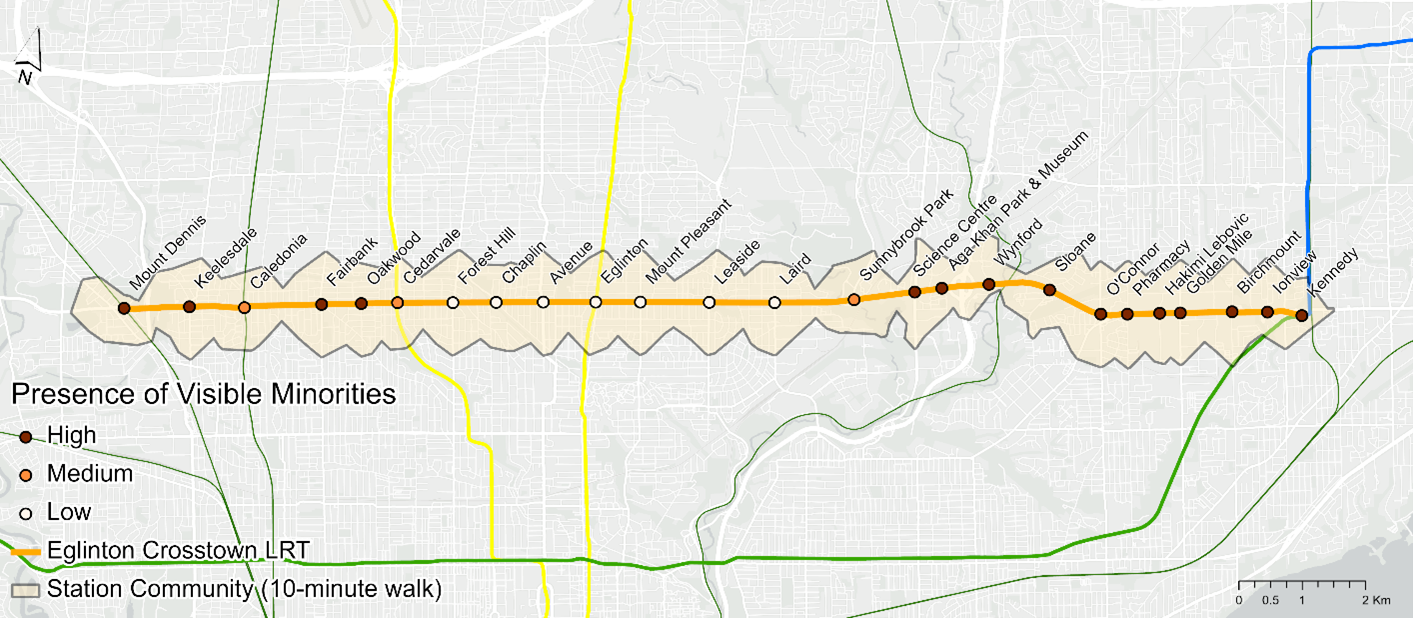
Figure 2 Classification of LRT Stations by Community Types (based on 2016 census data)
From Figure 2, 15 stations are in communities with a high presence of VMs, 7 located in communities with low presence of VMs, and 3 in communities with a medium presence of VMs.
The stations serving VM communities are at the east and west ends of the route. Stations, from Forest Hill to Laird, located in communities with lower presence of VMs are clustered in the middle section of the route. This dynamic is not surprising though, as over space, related things (e.g., households with similar incomes) tend to be closer to each other. In this instance, like some areas across Toronto, we see a potential clustering of people who share a similar ethnic background.
The Eglinton Crosstown LRT route passes through several racialized communities, and this can be particularly useful for this population. For instance, members of these racialized communities (who are more likely to depend on public transit in the Toronto context) can potentially access more opportunities and subsequently participate in city functions using the LRT. However, this LRT development can also lead to inequitable outcomes when there is an influx of capital, attracted by the associated investment, into these communities without appropriate policy controls that are targeted at mitigating issues of gentrification such as unaffordable housing, which can lead to pricing existing residents out of the housing market.
Real Estate Analysis Along the Classified LRT Stations
Next, I explored the average price of a single-family detached home for the station communities, using data from RPS Real Property Solutions (RPS). RPS Real Property Solutions (RPS) is a leading Canadian provider of outsourced real estate solutions including property valuations, business intelligence and mortgage-related services. (For more information, please visit www.rpsrealsolutions.com )
This set of analytics was explored to observe possible significant variations in both the average price of single-family detached homes by community type, as well as over time to further identify changes in average prices across the announcement and construction phases.
A transaction itself meanwhile is linked to just a single station community (i.e., transactions within a 10-minute walk of multiple stations are assigned to the nearest station). This assumes a behavioral position that all things being equal, people will walk to the nearest transit station.
Average Price of Single-Family Detached Homes by Stations
Generally, average housing prices were higher during the construction phase ($1.08 million) as compared to the announcement phase ($805k) across the entire line, representing an average increase of approximately 34%.
This is unsurprising as Toronto’s property market in general saw significant increases in property prices over time. Compared to the rest of the City of Toronto, property prices were slightly higher along the Eglinton Crosstown LRT. The average price of a single-family detached home in Toronto was $737k (announcement phase) and $965k (construction phase), representing an average increase of about 31%.
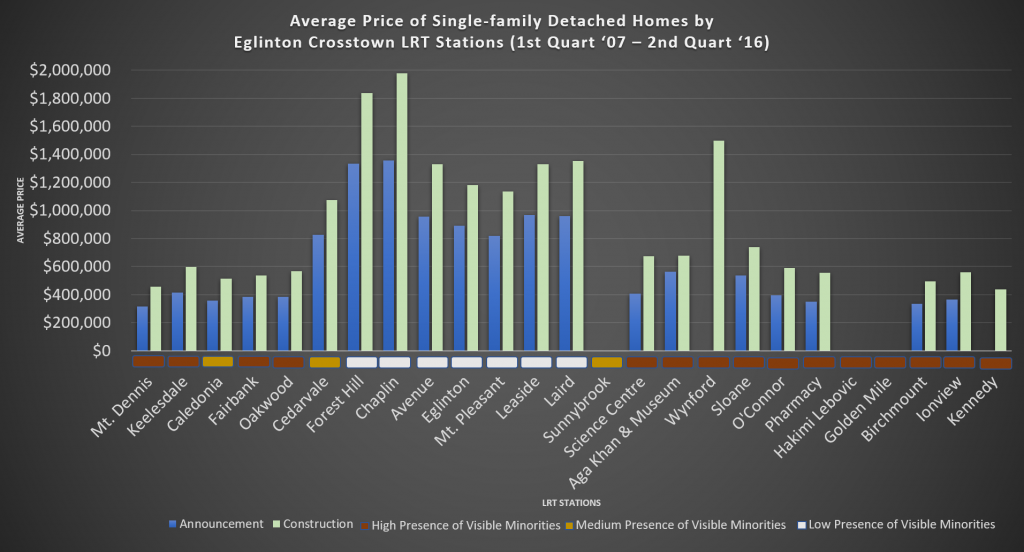
Significant differences in average price across station communities were observed in my analysis. In communities with low concentrations of VMs, single-family detached homes were very expensive – about $1.2 million across both project phases, with prices approaching $2 million around Chaplin and Forest Hill stations during the construction phase.
Conversely, communities with a higher presence of VMs recorded relatively cheaper transactions – with an average of approximately $390k in the announcement phase rising to about $580k in the construction phase. To note, the properties around the Wynford, Aga Khan and Science Centre stations are either mostly commercial (a Loblaws superstore, Aga Khan Museum, etc.) or purpose-built rental properties.
Generally, percentage changes in property prices across the two project phases were almost similar for different station communities – within 35% – 50%. Aga Khan & Museum (20%), Cedarvale (30%) and Eglinton (33%) were, however, below the identified range, while on the other hand, the percentage change in average prices in Science Centre (66%) and Ionview (53%) were above 50%.
Given the popular mantra regarding the three key determinants of property values, namely, location, location, location, it would be interesting and insightful to explore why there are variations in average prices by community types. This will involve a more complex model that includes information on factors such as the quality of buildings, notable facilities present, environmental and neighborhood qualities, varying income levels, among others. While such analysis is beyond the scope of this blog post, it is something we are hoping to analyze over the course of the Mobilizing Justice project to better understand and address the transit-gentrification nexus.
Conclusion
My analysis in this blog post explored socioeconomic and demographic variations, in terms of community types and average prices of single-family detached homes, across different stations on the Eglinton Crosstown LRT route. First, the Eglinton Crosstown LRT serves several VM communities. Second, the real estate analysis revealed that the average price of single-family detached homes was significantly higher in low VM communities than in high VM communities.
In the future, I hope to examine the actual influence of the Eglinton LRT on the surrounding real estate market. This will involve specialized spatial econometric analysis and techniques (e.g., hedonic regression models) that account for factors such as transit accessibility (e.g., savings in travel times), structural attributes (e.g., number of bedrooms and bathrooms), neighborhood characteristics (e.g., average household income) and comparable neighborhoods.
If you are interested in the impacts of transit investment on the real estate market, keep an eye out. As part of my PhD research, I am currently working on a couple of such projects, including a national-scale accounting of land value uplift. Also, at the SAUSy lab, University of Toronto, we are currently examining the outcomes of transit initiatives on neighborhoods through social issues such as access to food banks, transit-induced gentrification, and residential displacement as part of the Mobilizing Justice project.
I would like to acknowledge Jeff Allen and Chris Higgins for their insight into the analysis used in this article. Also, I am grateful to the Mobility Network, School of Cities, University of Toronto for organizing a Summer School where I learned how to perform areal apportionment analysis of census data – used in identifying station community demographics.
Disclaimer
Information contained herein contains information that is proprietary to RPS Real Property Solutions Inc. (RPS) and/or its third-party data providers. All right, title and interest in and to the RPS information belongs to RPS and its third-party data providers and (i) may not be copied or distributed; (ii) is intended for non-commercial use and for informational purposes on matters of general interest; and (iii) is not warranted to be accurate, complete or timely. Neither RPS nor its content providers, along with their respective parent companies, subsidiaries and affiliates, are responsible for any damages or losses arising from any use of this information.
References
Allen, J., & Farber, S. (2021). Suburbanization of Transport Poverty. Annals of the American Association of Geographers, 1–18. https://doi.org/10.1080/24694452.2020.1859981
Delmelle, E. C. (2021). Transit-induced gentrification and displacement: The state of the debate. In Advances in Transport Policy and Planning (Vol. 8, pp. 173–190). Elsevier. https://doi.org/10.1016/bs.atpp.2021.06.005
Higgins, C. D., & Kanaroglou, P. S. (2016). Forty years of modelling rapid transit’s land value uplift in North America: Moving beyond the tip of the iceberg. Transport Reviews, 36(5), 610–634. https://doi.org/10.1080/01441647.2016.1174748
Yousefzadeh Barri, E., Farber, S., Kramer, A., Jahanshahi, H., Allen, J., & Beyazit, E. (2021). Can transit investments in low-income neighbourhoods increase transit use? Exploring the nexus of income, car-ownership, and transit accessibility in Toronto. Transportation Research Part D: Transport and Environment, 95, 102849. https://doi.org/10.1016/j.trd.2021.102849
You may also like
 Making it safe, Making it work, and Making it fun: strategies for cycling with young children in Hamilton, Canada
Getting around by bike with young children is not always easy. Children are heavy, family schedules can be busy, and children often need to be… Read More
 What can we learn from a Bike Bus program in rural Nova Scotia?
There’s a revolution happening in the rural community of Hebbville, Nova Scotia (Mi’kma’ki) and it’s accompanied by a healthy dose of bike joy. Since 2020,… Read More
 Removing Fare Barriers: Free Public Transit for Youth Experiencing Homelessness in Toronto
Noah Kelly is the Director of Research & Partnerships at the Transit Access Project (TAP) and has recently completed his Master of Arts at McGill… Read More